{ringbp}:
Simulate infectious disease transmission with contact tracing
{ringbp}:
Simulate infectious disease transmission with contact tracing

![]()
![]()

![]()
{ringbp} is an R package that provides methods to
simulate infectious disease transmission in the presence of contact
tracing. It was based on an Ebola transmission model with ring
vaccination (Kucharski et al. 2016).
The {ringbp} model was initially developed to support a
paper written in early 2020 to assess the feasibility of controlling
COVID-19 (Hellewell et al. 2020).
See the companion analysis code to reproduce Hellewell et al. (2020).
For more details on the methods implemented in the
{ringbp} R package, see the Hellewell et al. (2020) paper, and the
package
documentation.
The package can be installed from CRAN using
install.packages("ringbp")You can install the development version of {ringbp} from
GitHub with:
# check whether {pak} is installed
if(!require("pak")) install.packages("pak")
pak::pak("epiforecasts/ringbp")
Alternatively, install pre-compiled binaries from the epiforecasts R-universe
install.packages("ringbp", repos = c("https://epiforecasts.r-universe.dev", "https://cloud.r-project.org"))The main functionality of the package is in the
scenario_sim() function. Here is an example for running 10
simulations of a given scenario:
library("ringbp")
library("ggplot2")

res <- scenario_sim(
  n = 10, ## 10 simulations
  initial_cases = 1, ## one initial case in each of the simulations
  offspring = offspring_opts(
    ## non-isolated individuals have R0 of 2.5 and a dispersion parameter
    community = \(n) rnbinom(n = n, mu = 2.5, size = 0.16),
    ## isolated individuals have R0 of 0.5 and a dispersion  parameter
    isolated = \(n) rnbinom(n = n, mu = 0.5, size = 1)
    ## by default asymptomatic individuals are assumed to have the same R0
    ## and dispersion as non-isolated individuals
  ),
  delays = delay_opts(
    incubation_period = \(x) stats::rweibull(n = x, shape = 2.322737, scale = 6.492272),
    onset_to_isolation = \(x) stats::rweibull(n = x, shape = 1.651524, scale = 4.287786)
  ),
  event_probs = event_prob_opts(
    ## 10% asymptomatic infections
    asymptomatic = 0.1,
    ## 50% probability of onward infection time being before symptom onset
    presymptomatic_transmission = 0.5,
    ## 20% probability of ascertainment by contact tracing
    symptomatic_traced = 0.2
  ),
  ## whether quarantine is in effect
  interventions = intervention_opts(quarantine = FALSE),
  sim = sim_opts(
    ## don't simulate beyond 140 days
    cap_max_days = 140,
    ## don't simulate beyond 4500 infections
    cap_cases = 4500
  )
)ggplot(
data = res, aes(x = week, y = cumulative, col = as.factor(sim))
) +
geom_line(show.legend = FALSE) +
scale_y_continuous(name = "Cumulative number of cases") +
theme_bw()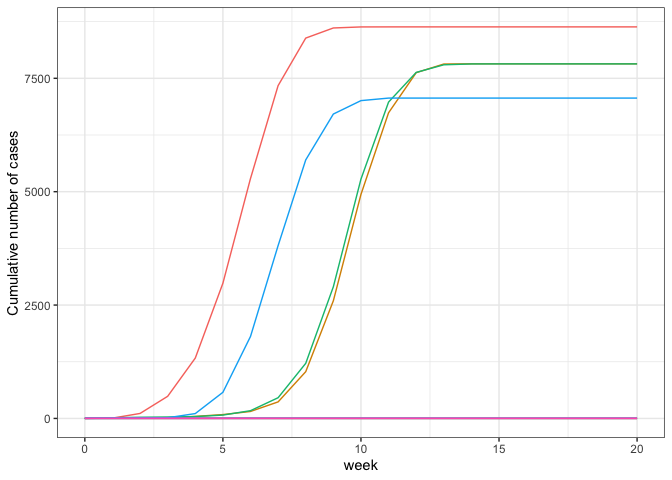
extinct_prob(res)
#> Calculating extinction using the extinction status from the simulation.
#> [1] 0.6Contributions to {ringbp} are welcomed. Please follow
the package
contributing guide.
All contributions to this project are gratefully acknowledged using
the allcontributors
package following the all-contributors specification.
Contributions of any kind are welcome!
seabbs, sbfnk, jhellewell14, timcdlucas, amygimma, joshwlambert, Bisaloo, actions-user
thimotei, adamkucharski, dcadam, jamesmbaazam
Please note that the {ringbp} project is released with a
Contributor
Code of Conduct. By contributing to this project, you agree to abide
by its terms.